Research
Research in the lab has migrated through various areas over the years, all focusing on populations, communities, and landscapes. We have used lots of laboratory and field experimental and observational data from numerous systems, and our work has spanned from local to global scales. The unifying aspects are a common interest in the ecological consequences of human activities, and a quantitative approach. Example projects/themes are below.
Currently active research:
Demography and species distribution models
This is a new line of work, begun a year or two ago together with Emilio Berti of iDiv in Leipzig, and recently joined by new lab postdoc Angel Robles. We’re pretty excited about it! We have some publications in the works, and a major NSF grant was recently funded.
Spatial synchrony
In many hierarchical dynamical systems, “synchrony” between multiple fluctuating variables, i.e. correlations or other similarities in fluctuations between variables through time, is more important than the individual variables themselves. For instance, a neuron may fire only when its input neurons fire synchronously. Or the electrical grid may crash only when demands of multiple users become synchronized, producing total-usage spikes. Ecosystems can show this type of dependence on synchrony. Ecosystems include multiple trophic levels, with population signals from lower levels often being spatially aggregated to affect higher levels. For instance, a predator is only harmed if its prey are scarce over its whole hunting area. For systems of this type, it is primarily the synchronous components of signals that matter in the average signal that affects the next level – non-synchronous components tend to cancel in the average. Synchrony is found throughout ecology. We have studied synchrony in spatial/metapopulation (here) and community (below) contexts. We have helped develop timescale-specific approaches (e.g., Sheppard et al, 2016, 2019; Castorani et al, 2022; Reuman et al, 2023, Walter et al, 2024), geographic approaches (e.g., Walter et al, 2017, 2020; Wanner et al, 2024), and approaches taking into account asymmetries of association in synchrony (e.g., papers by Ghosh et al from 2020; and Walter et al, 2022). We have studied spatial synchrony in systems as diverse as aphid crop pests in the UK, plankton in both marine and freshwater systems, lab beetle systems, lepidopteran crop pests in the US, mosquitos, grasslands, cicada vocalizations, anadromous fish movements, white-tailed deer, corals, and giant kelp.
Asymmetric tail associations
Stability and synchrony in communities
Some past research (still interested, currently inactive):
Whole community effects of warming
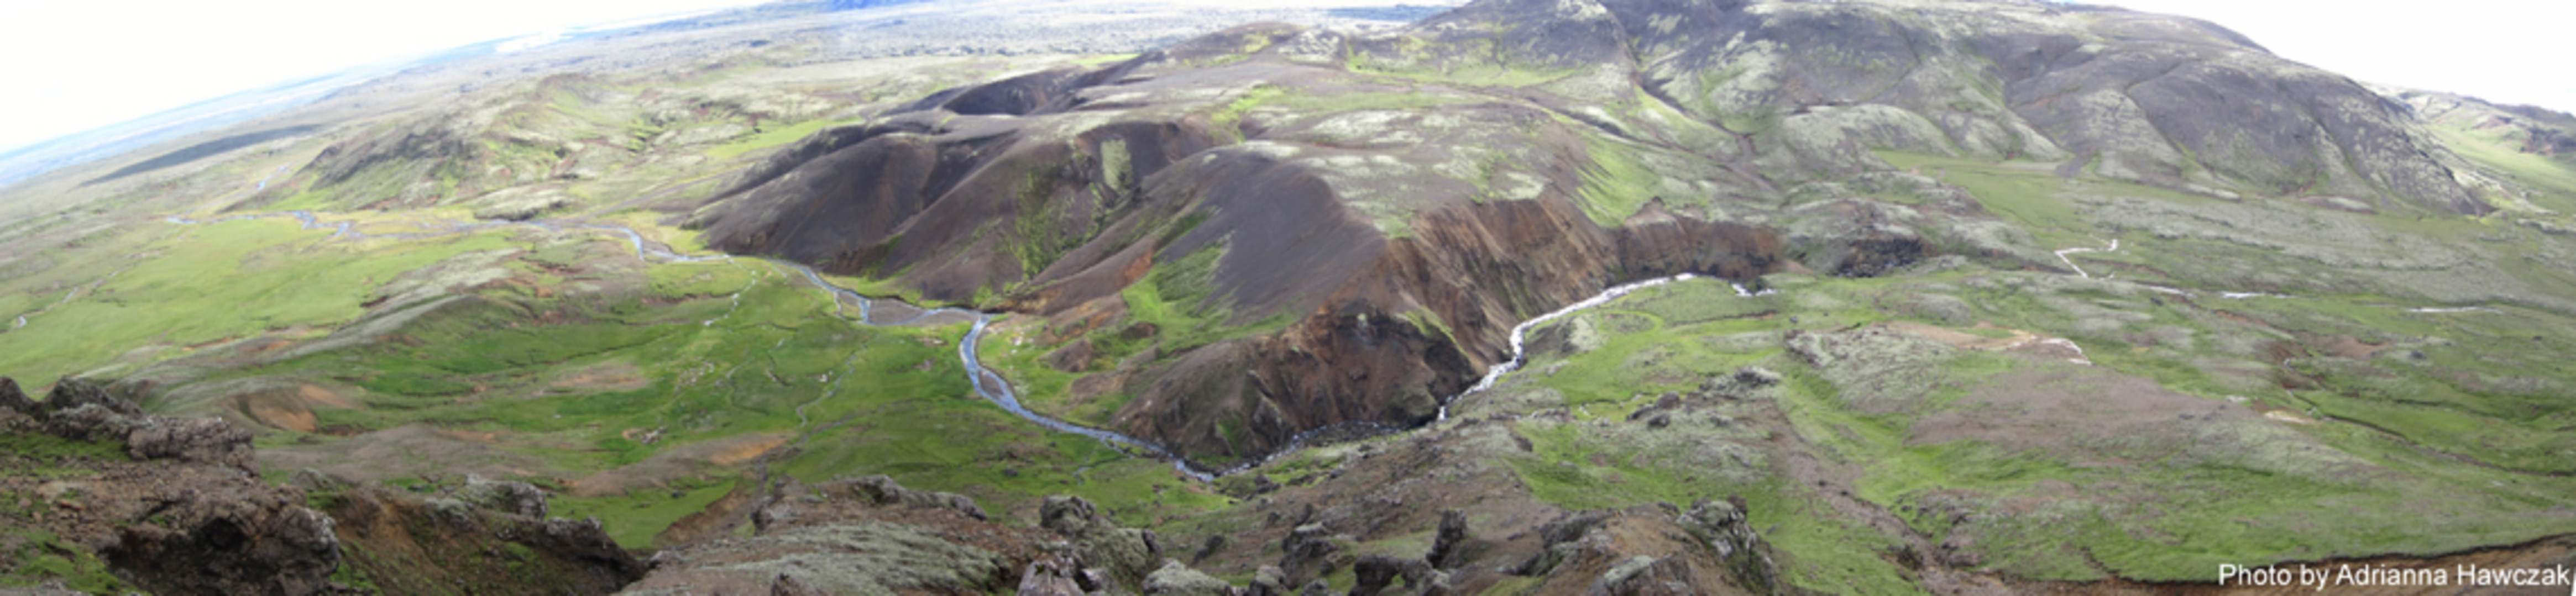
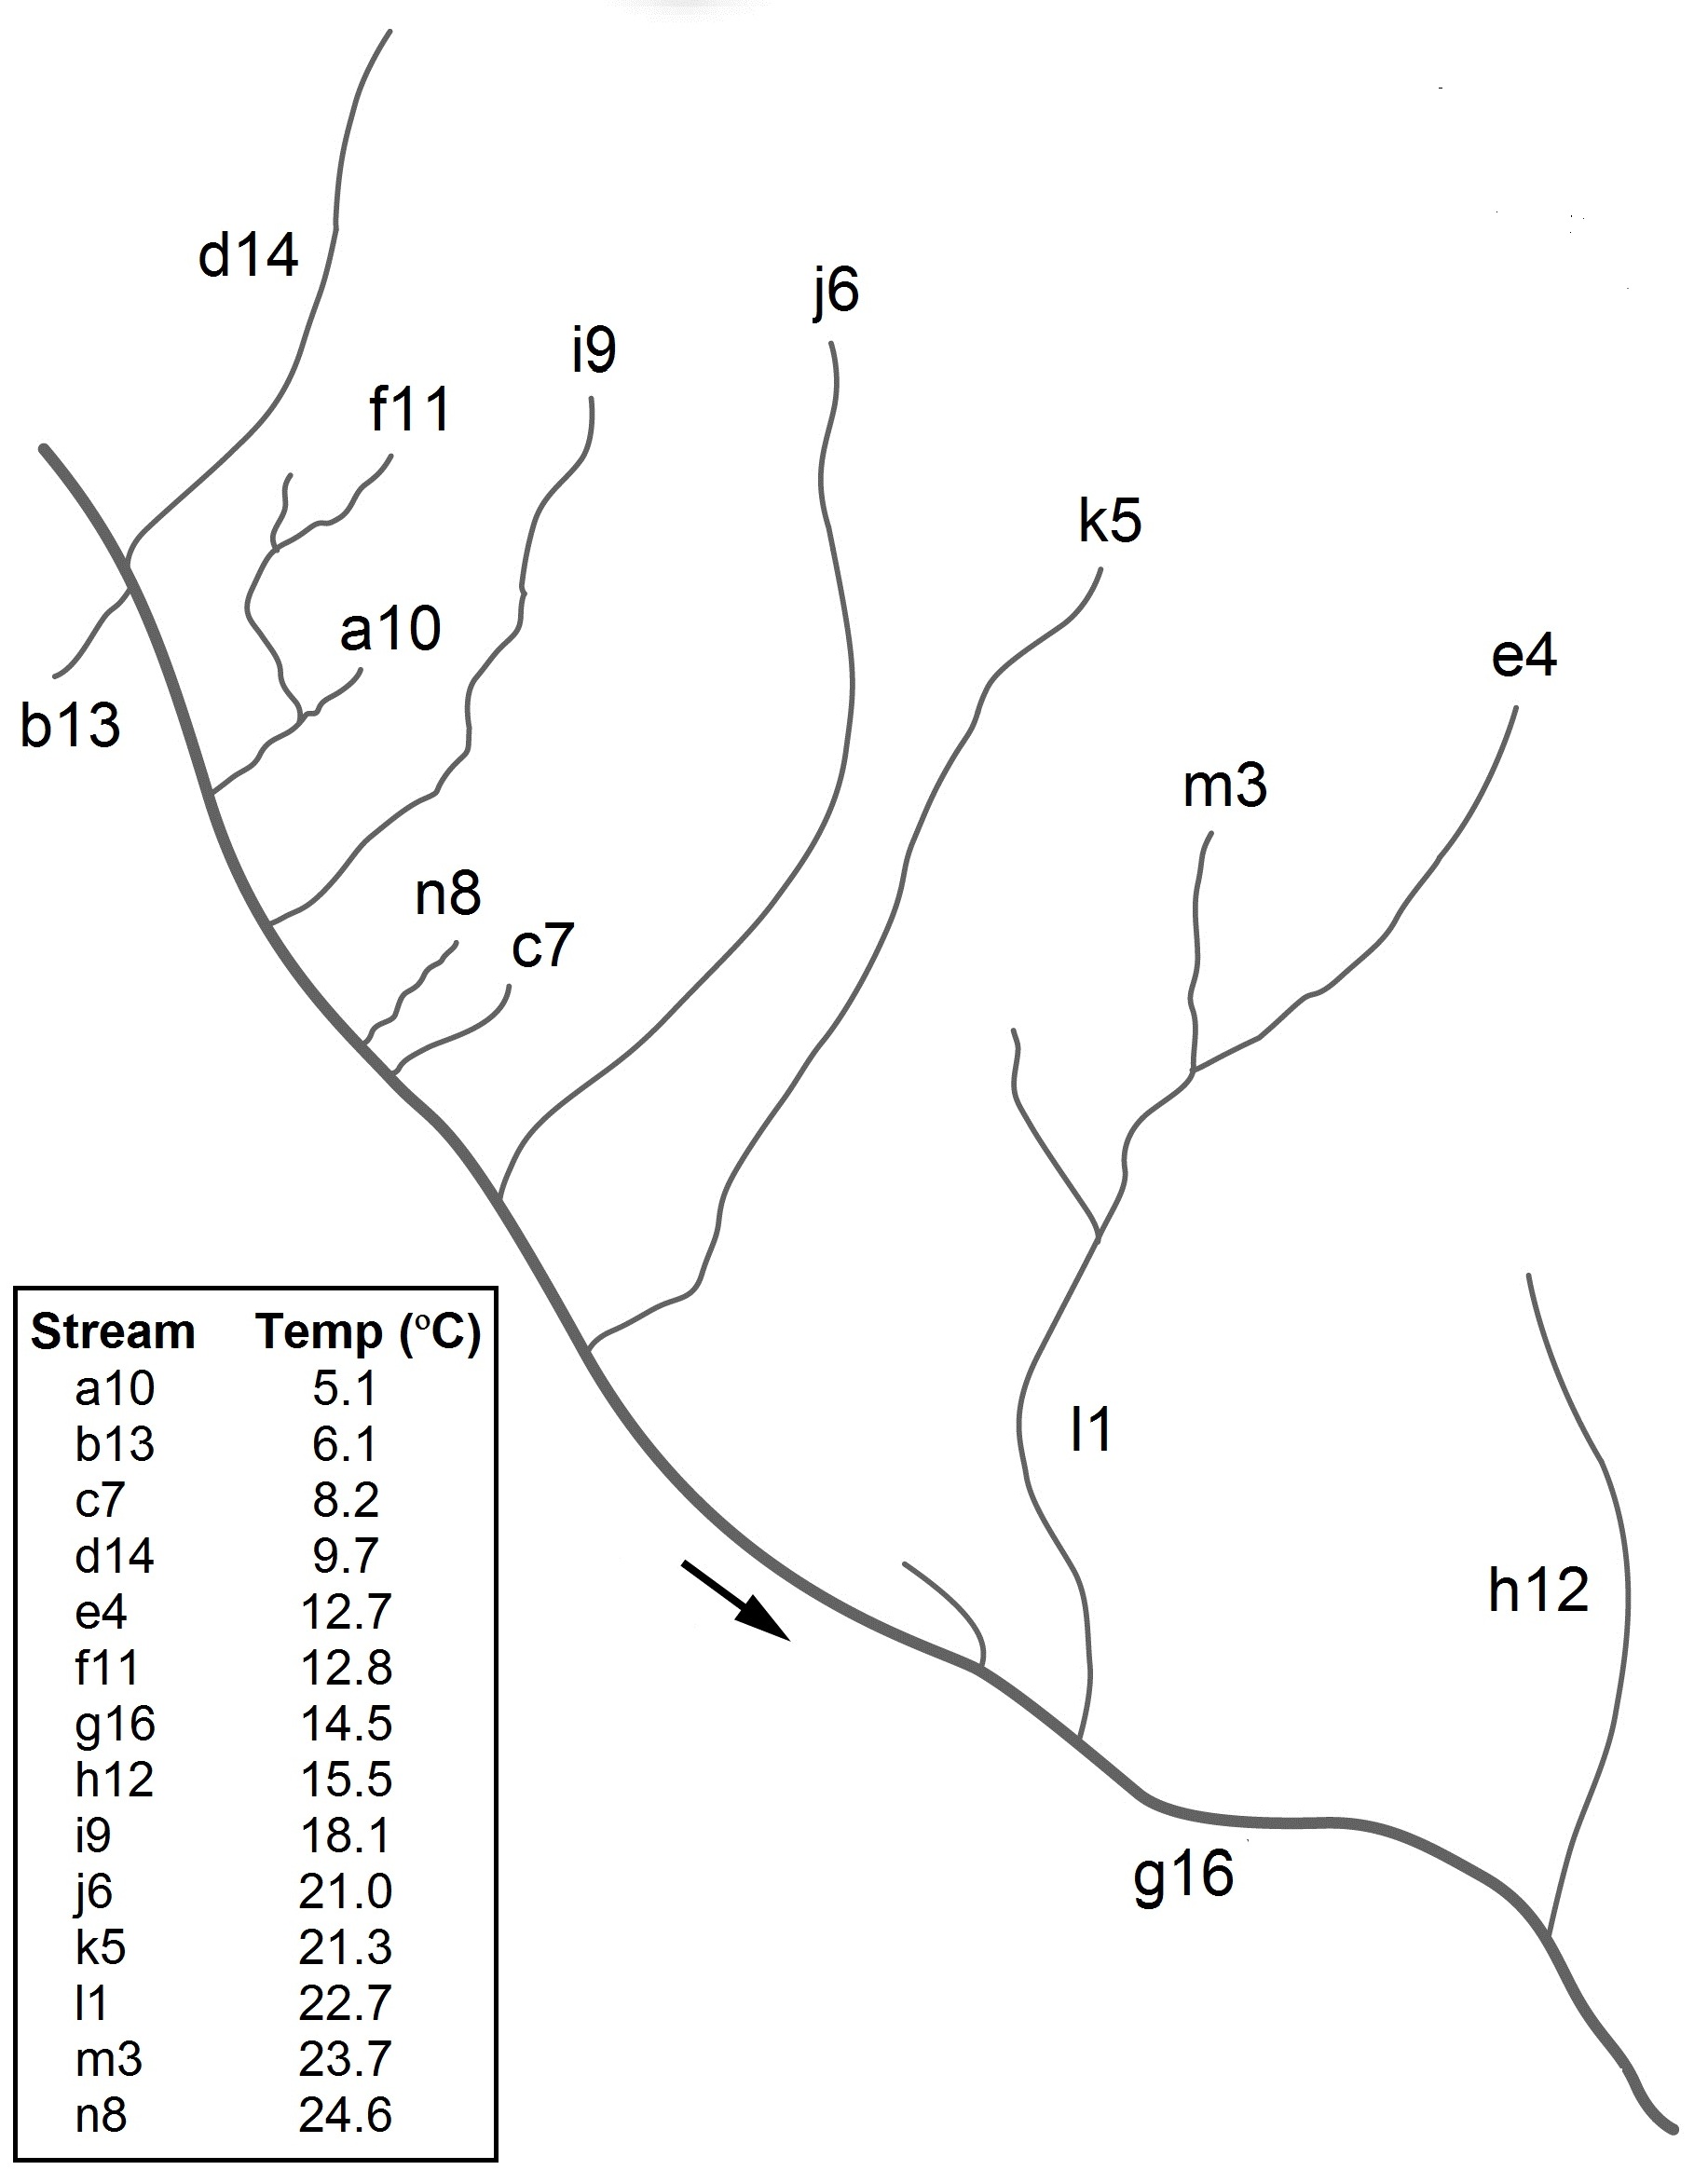
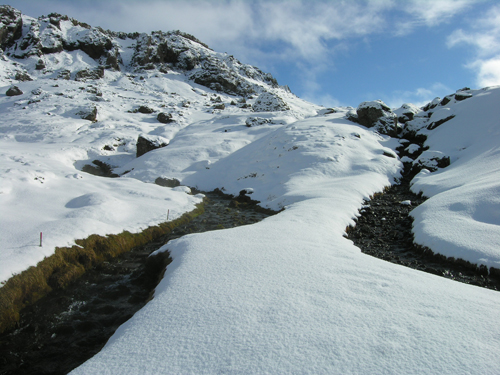
Warming has very well documented and comparatively well understood effects on populations and single species (latitudinal and altitudinal range shifts and phenological shifts, body size reductions over time), but community level effects of warming are still poorly understood. Nevertheless, whole-community effects are likely to have important consequences for biodiversity and ecosystem functioning. Members of the lab form the quantitative end of an international collaborative network studying community-level warming effects in two unique model systems. The first is a system of replicated pond mescosms, half of them warmed on a long-term basis by ~4 degrees C from ambient (Fig. 1). The systems are intensively sampled for their plankton populations as well as for carbon and nutrient exchange and cycling. The second is a unique system of geothermal streams in the Hengill region of Iceland (the banner photo of this page is a view of the system from above). The streams range in temperature from 5 to 25 degrees C, but are all within 1km of each other (Fig. 2), and are connected to the same main stem, so the dispersal constraints and covariates that often confound biogeographic studies of the effects of temperature are not a problem. The system also includes a temperature manupulation of one of the streams (Fig. 3), so that experimental, short-term warming can be investigated as well as making observations about long-terms effects of warming.
Further information:
O’Gorman et al, 2017, Nature Climate Change
Yvon-Durocher et al, 2015, Plos Biology
Reuman et al, 2014, Journal of Animal Ecology
Adams et al, 2013, Global Change Biology
Hudson et al, 2013, Methods in Ecology and Evolution
O’Gorman et al, 2012, Advances in Ecological Research, 47, 81.
Woodward et al, 2010, Advances in Ecological Research 42, 71.

History of habitat fragmentation
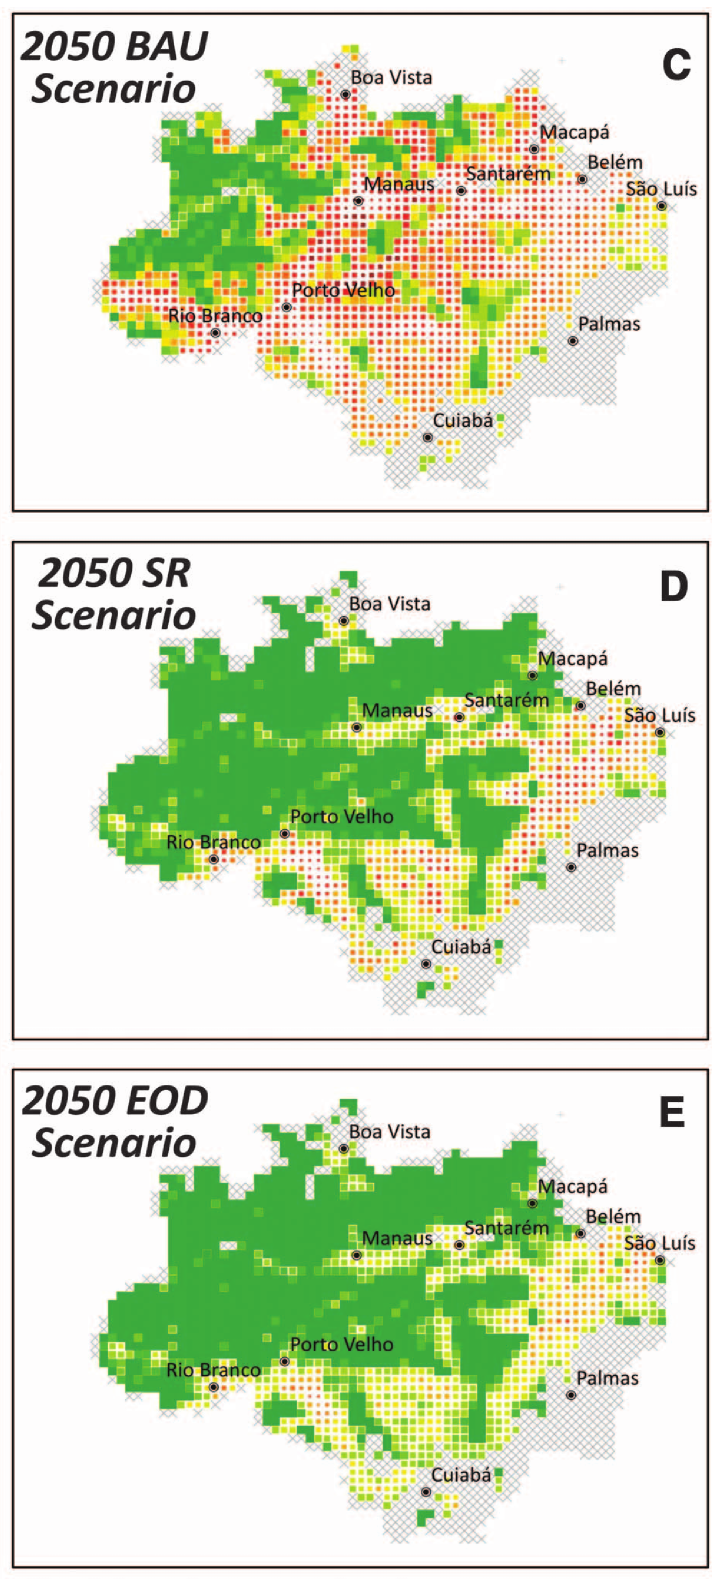
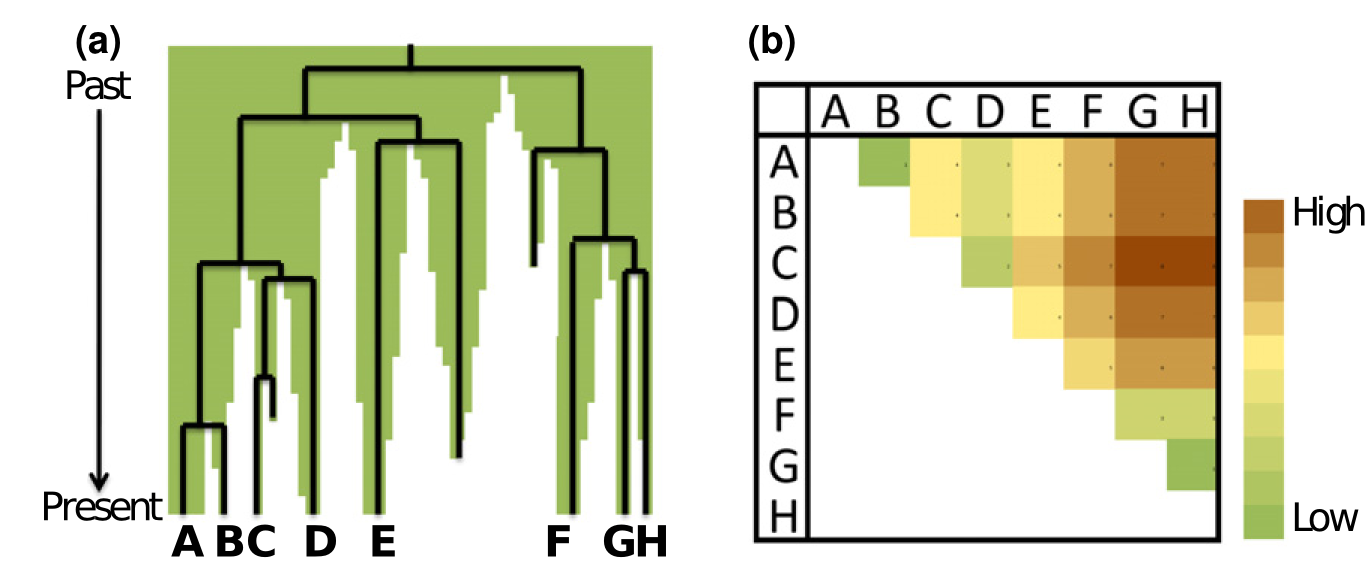
Habitat size and degree of habitat fragmentation have long been known to affect remaining biodiversity and its distribution across a landscape. For instance, both the amount and degree of contiguity of undisturbed rainforest in a part of the Amazon can determine the number and type of species that live in the region. It is increasingly recognized, however, that not only the current configuration of the habitat in a region affects its biodiversity, but also the historical trajectory by which the habitat arrived at its current state. The habitat in a landscape may have been degraded and fragmented slowly or quickly, recently or a long time ago, with substantially different implications for the current and future biodiversity it supports. Members of the lab have made contributions to two large efforts to understand and quantify two distinct but related aspects of this historical influence. The first effort Wearn et al, 2012, Science) considered extinction debt, the phenomenon whereby extinction events continue to occur gradually over time following an episode of partial habitat destruction, sometimes continuing decades after the destruction itself. So reduced habitats harbor species which are committed to extinction. We estimated local extinctions and extinction debts of birds, mammals, and amphibians across the Amazon (e.g., Fig. 1, see also the movies in the supplementary materials of (Wearn et al, 2012, Science). The second effort considered the history of habitat fragmentation in an area using a data device similar to a phylogeny, which we named a “terrageny”. Splits in a phylogeny represent evolutionary divergences, whereas splits in a terrageny represent fragmentation events (Fig. 2). We developed theory on how terrageneitc structure should affect communities within fragments and distributions of biodiversity across the landscape (Ewers et al, 2014, Ecol Lett). Both projects and ongoing work are collaborations with the lab of Rob Ewers at Imperial College London.
Further information:
Ewers et al, 2014, Ecology Letters
Wearn et al, 2012, Science
Applications and implications of body-size scaling in communities
Many biological rates (e.g., metabolic rates, population growth rates, consumption rates) are strongly correlated with body size, and members of the lab (and many others) have used or studied these relationships for many years for a variety of purposes in community ecology. Indeed, the “whole community effects of warming” research topic described above is also an outgrowth of this general allometric approach. A feature that distinguishes work in this vein in the Reuman lab is the focus on complete local communities. Early work included characterizations of population density-versus-body size scaling in complete local communities (e.g., Reuman et al, 2004, J Anim Ecol; Cohen et al, 2009, PNAS), and variation in these relationships among communities (e.g., Reuman et al, 2009, Adv Ecol Res). An energetic-balance explanation for observed patterns was provided and confronted with data from many ecosystems in Reuman et al, 2008, Ecol Lett. We have studied the body-size scaling of metabolic rates directly (Hudson et al, 2013, J Anim Ecol). Recently we have used size-scaling of rates and a mechanistic model to propose a competition-based mechanism for widely observed shifts toward smaller body sizes in ectotherms: at least for phytoplankton and phytobenthos, warming accentuates competitive advantages that smaller cells have in nutrient uptake and growth (Reuman et al, 2014, J Anim Ecol). In a recent modelling effort (Hudson et al, 2013, Proc Roy Soc B), we demonstrated that allometric scaling of biological rates is not only sufficient but also necessary to make dynamical models of complex communities realistic in important respects. This theme informs the previous theme – see above. We have also studied the biogeography of the size-scaling of diversity in marine systems – see below.
Further information: See papers mentioned in the text.
Funding: UK NERC, NSF
Video: Demonstration of model-data agreement as per Hudson et al, 2013, Proc Roy Soc B. A dynamical model settles down to represent community patterns of population density versus body mass quite accurately in the left panel, but not in the right panel. It is in this sense that body-mass allometries of biological rates such as growth rates, metabolic rates, and consumption rates are necessary and sufficient for accurate modelling of community dynamics. Data are from Tuesday Lake, a well-studied system. Green circles are phytoplankton species, blue squares are zooplankton species, and purple diamonds are fish. The smaller dots are model predictions, so good agreement means the vertical stalks connecting model and data are small. The music is just for giggles. Video credit: Lawrence Hudson.
Biogeography of marine communities
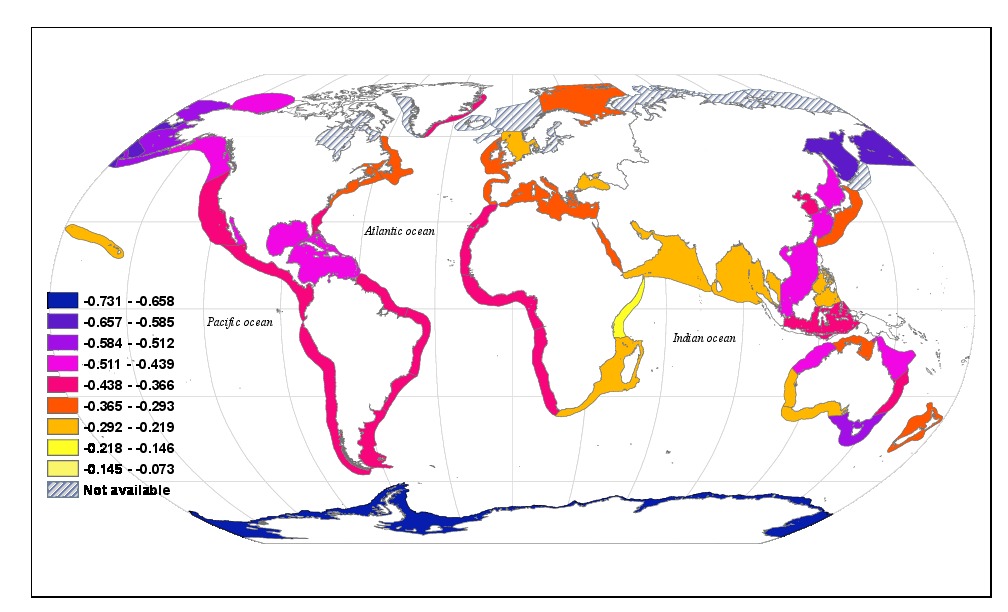
Most species are small. The nature of this bias and its causes and ramifications have been studied in an evolutionary context for decades. But we carried out a major study which was one of the first to focus instead on the community level, asking how diversity-versus-body mass relationships can be explained for geographically delineated but taxon-inclusive assemblages, i.e. all the species in a region? Specifically, we asked how diversity is distributed across an axis of body size in the world’s continental shelf seas. We defined and used the “diversity spectrum” to describe how diversity varies with body size – this is a species analogue of the classic abundance/size spectrum of individuals. We produced a state-of-the-art unified theoretical and empirical synthesis (Reuman et al, 2014, J Anim Ecol; see also this commentary, Extracting order from elegant chaos: implications of the marine diversity spectrum). Several theoretical predictions were borne out by our global empirical analysis. For instance, fewer large species per small species were predicted (and were found) in colder and larger regions.
Invasive species
Projects can be available, co-supervised by other researchers, involving field or laboratory components. A good example is the work of Lisa Signorile, PhD, a student who graduated from the lab. In collaboration with Chris Carbone and Jinliang Wang of the London Zoological Society, Peter Lurz of the University of Edinburgh, Sandro Bertolino of the University of Turin, and Dan, Lisa studied the population genetics of invasive American grey squirrels in Europe. She collected DNA from over 1500 squirrels from over 50 populations in England, Wales, Scotland, Northern Ireland, the Republic of Ireland, Italy, and the USA, and came to several conclusions about the genetic structure of the populations which should impact management of this and other invasions. One main result was linking expansion rate of new population nuclei to local genetic diversity. Managers should prioritize prevention of mergers of genetically distinct populations and translocations between such populations.
Further information:
Signorile et al, 2016, Biological Conservation
Signorile et al, 2016, Diversity and Distributions
Signorile et al, 2014, Diversity and Distributions
Signorile et al, 2014, Biological Invasions
Main external collaborators: Chris Carbone, Jinliang Wang, Peter Lurz, Sandro Bertolino